Introduction
Big Data involves large volume of data, which cannot be processed using traditional tools. These data sets are complex and evolves continuously in real time. The challenge is to analyze and extract useful knowledge from this volume of data. The paper focuses on analyzing New York City Taxi data (from Jan-2015 to Jun-2015). There are many areas which can increase an organization's profit by observing user patterns. Hence, we need some techniques in order to analyze the user behavior and accordingly generate some patterns. In this paper we will propose some general ideas by which we can gather user behavior and how that information can be used to generate further information specific to a user. We will use Hadoop echo system as our framework that will implement Map-Reduce to analyze these patterns in an acceptable time. Based on these patterns, we can suggest the user of the other related patterns.
DataSet
2015 Dataset
Number of Records: 77,080,575 Rows
Size of the file: 10.9 GB
Link: https://data.cityofnewyork.us/view/ba8s-jw6u
Other Data Sets
2014 DataSset
2013 Trip Dataset
2013 Fare Dataset
Pre-Processing
Pre-processing has been performed using python script. Below are the type of record which will be deleted after pre-processing
- Record with less then 17 attributes.
- Record with pickup latitude and longitude as 0.00,0.00
- Record with drop-off latitude and longitude as 0.00,0.00
- Record with same latitude and longitude
Problem Statements and Result
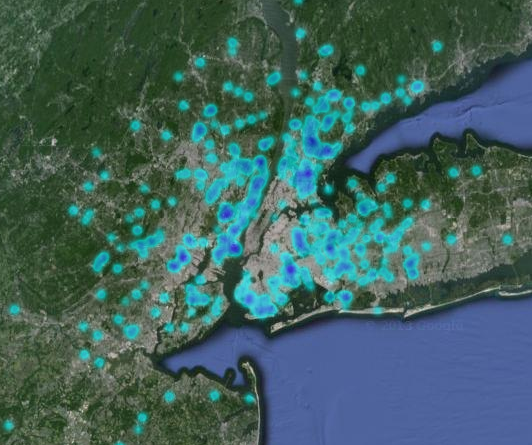
Busiest area of New York
For calculating busiest area of New York we have calculated pickup and drop-off location counts by rounding latitude and longitude to 3 decimal points. What about the precision of the location? What is the distance between the two rounded points? - answer of which, is not general for all the locations on the earth. General New York latitude and longitude is 40.XXXXX and -73.XXXXX/-74.XXXXX. Now as per the wikipedia distance between two decimal points, we round it based on 45N/S shown below. We have rounded latitude and longitude by three decimal points in pickup and drop-off locations, so the distance between the two points will be approximately 80 m.
|
Top Pick up Location
|
|
Top Drop off Location
|
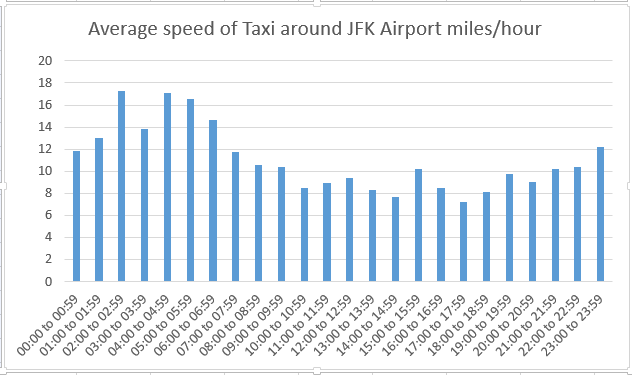
Traffic analysis by the taxi speed
We have used basic concept of physics speed = distance /time in this analysis and derived average speed, around a particular location. We have considered the drop-off location to compute speed. After specifying the drop-off location latitude and longitude, we get the average speed of the taxi around that location for every one hour. We have applied the logic- that if the average speed is high at a particular location, it implies that traffic is less in that area.
Most hectic hours of the day
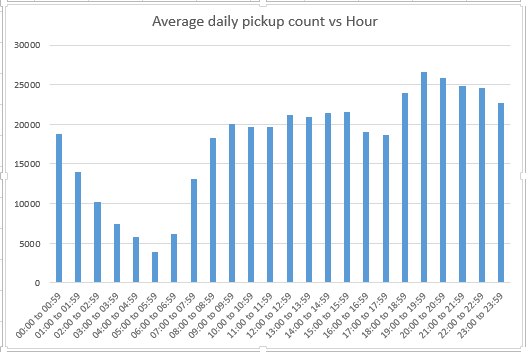
One of the outputs we derived from this analysis was average number of pickups for a day in New York and for that we rounded the pickup time by an hour and counted the number of pickups for every hour and then we just divided the final count by 180 (because our data is from 01-Jan-2015 to 30-Jun-2015 which is 180 days). Using these outputs, taxi drivers can schedule their day and hence make maximum profit in a day.
Most generous area of New York
As a final output, we calculated location wise, tip percentage. We counted the percentage tip given to the driver after rounding location by 3 decimal points and taking average of (tip_amount/total_amount)*100%.